Request an account — an administrator will review it.
Start here — a plain-English primer
What can you trade, and what moves the price?
New to markets? Before we get to the tool, here's the groundwork. "Trading" means betting on whether a price will go up or down. There are four main kinds of thing whose prices you can follow — and each is pushed around by different forces. Understanding those forces is what makes a price move predictable.
The four types of instrument
🏢
Shares (equities)
A tiny slice of ownership in a single company — Apple, Shell, Volkswagen. You profit if the company becomes more valuable.
What moves the price: profits and sales growth, new products, the level of interest rates (cheap money lifts shares), competition, and plain crowd sentiment. Company news can move one share while the rest of the market sits still.
📊
Indices
A single number that tracks a whole basket of shares at once — the FTSE 100 (biggest UK firms), S&P 500 (biggest US firms), DAX (Germany). It's the market's "temperature".
What moves the price: the economy as a whole — interest rates, inflation, jobs, growth (GDP), politics and global events. One company barely matters; the mood of the entire market does.
💱
Currencies (FX)
The exchange rate between two currencies — how many US dollars a pound (GBP/USD) or a euro buys. You bet one currency will strengthen against another.
What moves the price: the gap between countries' interest rates (money flows to where it earns more), inflation, central-bank decisions, trade balances and confidence in a country.
🛢️
Commodities
Physical raw materials — gold, oil, natural gas, copper, wheat. Real things with real supply and demand.
What moves the price: how much is produced vs. how much is needed, weather and harvests, wars and geopolitics, and the US dollar (most are priced in dollars, so a stronger dollar tends to push them down). Gold also rises when investors are fearful.
(There's also a fifth, newer type — crypto like Bitcoin — driven by adoption, sentiment and liquidity. We cover a handful of the largest.)
Where this tool fits in
Whatever the instrument, prices don't crawl steadily — they go quiet, coil tighter and tighter, then break out and move fast. This tool watches over 1,700 instruments across every asset type, spots those coils early, and tells you the exact levels to act on. You don't need to understand every force above — the scanner does the watching. When you're ready for the detail, the How it works tab explains the pattern, and the Appendix defines every term.
A research tool — not financial advice. Prices can fall as well as rise.
Scanner
Scanner Report
Every instrument we scan across shares, indices, FX and commodities — squeezes spotted early, with the exact levels to act on. Use the charts or Filters to narrow; click a row for full detail.
This is a live list of what's actionable right now, not a history — a squeeze that has gone stale or already resolved drops off here even though it's still recorded, and only setups passing My Trading Filters appear at all. For the full historical record, and to slice it, see Squeeze History or Performance.
⏳ Data loading…
★
Name
Direct
MCap
RVOL
VWAP now
ATR now
Vol
R:R
Quality
Dist→Entry
Status
Triggered
Days since
Now
Target
To target
Market
X posts
Since trig
P/E
Insider %
TF
Location
Lev
Sector
Ticker
In Pre-orders?
⏳ Data loading…
Trading
My Pre-orders
Instruments with a pre-order — waiting for the entry to trigger. Click a row for detail, or tick rows then Delete to dismiss. Pre-orders to IG are currently disabled.
★
Name
Direct
MCap
RVOL
VWAP
ATR
Vol
Status
Market
Now
Entry
Stop
Target
Dist→Entry
R:R
Quality
TF
Added
Source
Sector
Ticker
Trading
Pre-orders to my IG
Every move of a scanned setup toward a live IG working order. WATCHING = tracked, not yet on IG (price outside the 1.5% band) · PENDING = live working order on IG · FILLED / EXPIRED / CANCELLED = outcome · DELETED = dismissed from Pre-orders by a user. The bridge checks READY setups (Quality > 50) every 2 hours.
Closed:
★
Placed
Updated
Name
MCap
RVOL
VWAP
ATR
VolumeScore
R:R
Quality
Direct
Entry
Stop
Target
Dist %
Size
Status
Source
Notes
Ticker
Publishing📅
X Posts
Every tweet we've published, newest first. Click a chart to filter; click a row's link to open the tweet on X.
Published (UTC)
Name
Market
Thread
Ticker
Link
Settings
Configuration
Your personal preferences, the shared trading controls, and credentials — each on its own card. Every change is recorded in your activity log.
Saved filter defaults
Covers the Squeeze History filters, the Pre-orders filters and what remains on the Scanner Report. Set them how you like, then save — they're applied automatically every time you log in, and Reset returns to them. Separate from My Trading Filters, which gate what may actually be traded.
⏳ Data loading…
My Trading Filters
Your personal floors. R:R, Quality, RVOL, VolumeScore, VWAP, ATR expanding and instrument value are enforced on your own manual actions and at the automated engine's final order-placement checkpoint. If a required live metric is unavailable, an automated order is blocked rather than sent without evidence.
Trade filters — direction
Only ticked directions may be traded. Ticking both (or neither) = no restriction.
⏳ Data loading…
Minimum trade (£)
Max position size (% of wallet)
Max open positions (0 = Auto)
Minimum R:R Reward:Risk compares potential gain from entry to target with potential loss from entry to stop. R:R 3 means the target is 3 times as far away as the stop.
Maximum R:R Hides setups whose ratio is above this. A very distant target with a tight stop can be mathematically valid but not actionable. 0 = off (no ceiling). This is your own preference; a separate global check still rejects broken target levels.
Minimum Quality (Q)
Minimum Volume Score (0–12)
Minimum RVOL
Require price above VWAP
Require ATR expanding
Auto-close a failed open Closes a position on its opening day if the volume tests measured on that bar fail
Min instrument value (MCAP, 0 = off)
Max instrument value (MCAP, 0 = off)
Bounce alert
Bounce lookback (hours)
Email recipients (comma-separated)
Tab visibility
Tick the tabs you want to see. Configuration always stays visible.
⏳ Data loading…
IG Leverage (Broker) — by instrument type
Your broker's leverage for each instrument type. Shown as the Leverage column in the Scanner. Defaults match IG UK retail margin (FCA/ESMA caps): FX 30, Indices 20, Commodities 10, Equities 5.
FX
Equities
Commodities
Indices
My Trading Filters — affects live orders
Which squeeze setups may be traded on the live IG account.
Automatic bridge execution
Yes = the 2-hourly bridge (and 28-day lifespan orders) may place squeeze setups as live IG working orders. No = the bridge scans and reports but places nothing.
Bridge may place orders
My squeeze order controls
Max trades per instrument / day
IG working-order lifespan (days)
Pre-order to IG threshold (%)
🏃 Let winners run
Adds the historical "Let winners run" illustration to the Performance tab. It compares a target-lock-and-trail exit model with selling at target. This is an illustration only — it never changes live IG orders.
Show the "Let winners run" report
Stop-loss trail before target (%)
Trail below price after target (%)
Trading (Momentum) — affects live orders
Which monitor sources may place live orders.
Trade execution by source
Yes = that source may place live IG trades/orders; No = it scans and reports but places nothing. These switches are shared (one trading account) — the change is attributed to you.
⏳ Data loading…
⏳ Data loading…
Admin📅
Batch Activity
Execution log of the scheduled cron-job.org runs and the manual "Refresh data" button. High-frequency jobs that run every 5 minutes (e.g. the US monitor) are deliberately excluded to keep this readable.
When (UTC)
Source
Event
Operator
Admin
User Management
Manage logins — assign a subscription role and enable or disable accounts. Roles: Admin (full access), Gold (read/write incl. pre-orders + multi factor momentum trading), Silver (read/write incl. pre-orders), Guest (read-only, no pre-orders).
Pending account requests
Requested
Name
Email
Note
Action
Name
Email
Admin
Support
Subscription
Status
Fees discount
Password Complexity
IG account (audit)
Admin📅
Version History
A log of changes to the application — date, version and a summary.
Date
Version
Category
Summary
Admin📅
System Logs
Live server health and the most recent log records from this web-server process. Click a chart to filter the log table.
Time
Level
Module
Message
Admin
Scheduled Jobs
Every scheduled job that drives the system — its cadence, category and recent GitHub Actions run history. Definitions come from the cron registry; run stats from the Actions API (cached ~30 min). Click a chart to filter the table.
Job
Category
Style
Frequency (UTC)
Last status
Last run (UTC)
Duration
Runs
Failures
Workflow
Documentation
Guides for using and supporting the platform, as Word documents. You see the guides available to your role — everyone gets the User Guides; Support and Operations guides are shown to Support and Admin staff.
Admin
How it works (System)
The plumbing behind the product: where code runs, how the external services connect, and how the system is patched, secured and restarted — and, first, the market hypothesis it all exists to trade.
The hypothesis — The Squeeze
Markets alternate between calm and movement. When a price coils — its swing highs stepping down while its swing lows step up — volatility is contracting into a squeeze: the same information that once needed a wide range to digest is now being priced in an ever-tighter one. That compression is unstable. Energy stored during the squeeze is released when price finally breaks one edge, and the resulting move tends to travel about as far as the squeeze was tall at its mouth — so the squeeze that hid the setup also measures it. The system hunts these squeezes across every instrument, and the moment one breaks it already knows the three numbers that matter: where to enter, where the idea is wrong, and how far it should run.
The squeeze mouth (its full height at the left, when volatility was widest) is projected up from the break to set the target — the move is expected to travel roughly the squeeze's own height. Entry is the last swing high H3; the stop sits just past the opposite pivot L3, so the risk is defined before a penny is committed. A short is the mirror image: highs and lows swap, price breaks L3 downward, target projects down.
The system that runs it
IG
IG Markets
REST API at api.ig.com. Each session logs in with an API key + username + password and holds CST/security tokens (~6h, auto-refreshed). Per-user credentials: the owner uses the environment credentials; another trader must store their own in Configuration > IG — orders are placed under the acting user's own session (never someone else's). Working orders carry a configurable lifespan (default 28 days).
DB
Supabase
Shared Postgres reached via the session pooler (pg8000). Key tables: price_history (golden OHLC), working_orders, hvf_triggers (performance tracking), x_publications, signal_log, app_config (runtime switches), web_batch_activity + web_activity_log. The website and GitHub Actions read/write the SAME database — that's how one config switch controls both.
X
X (Twitter)
Posting uses tweepy with keys held ONLY in GitHub Secrets — the website never posts. Live posting runs inside GitHub Actions workflows, capped per day (Configuration > X settings), deduped via x_publications. The X Posts tab reads that table.
S
Slack
Simple incoming-webhook URLs per channel (signals, alerts, daily, trades, weekly + arw-rw-hvf). Reports post independently to each webhook — one failing never blocks the others.
PY
Python execution
Web tier (IONOS): this Flask app, served through CGI/WSGI at squeezescanner.cloud. It reads and presents data only — it never scans and never places an order itself. That is deliberate: the host runs several worker processes, so a background loop inside the website would duplicate its own work. Cloud: GitHub Actions runners (Python 3.12) do all of it — the session monitors, the Squeeze report, the nightly Scanner rebuild, the order bridge, the audits and the database backup — each started by cron-job.org calling workflow_dispatch (GitHub-native cron is deliberately not used).
CJ
cron-job.org
The external scheduler (the 📅 node in the diagram). Every job fires on its own cron by calling GitHub's workflow_dispatch API — GitHub-native cron is deliberately avoided in favour of cron-job.org's visible, editable schedule with per-run history. Each job carries a GitHub token in its Authorization header to dispatch its workflow: the 5-minute session monitors, the daily Squeeze report, the price-data refresh and the data-quality audits all start here. Jobs are managed with setup_cronjobs.py against the cron-job.org API (key held in the encrypted secret store); the Scheduled Jobs tab lists every job's cadence and recent GitHub Actions run stats.
GIT
Patching & releases
Code lives in the GitHub repo. A change is committed + pushed; Actions jobs pick it up on their next run automatically. The website is a separate step — build_ionos_package.py builds a production-only archive that is extracted into the IONOS domain directory (keeping .env, data/ and .venv_linux/). So a push updates the automation immediately, while the site changes only on the next package deploy. Every commit appears automatically in the Version History tab (generated live from git).
SEC
Security
Passwords: PBKDF2-HMAC-SHA256, 200k iterations, per-user salt — never stored or committed. Secrets: Fernet-encrypted at rest, masked to last-4 in the UI, never sent in full to a browser. Access: admin flag + subscription levels; admin-only tabs/endpoints return 403 otherwise; logged-out visitors get a stripped teaser Scanner. Password reset = emailed one-time code (10-min expiry, single use). Every sensitive action lands in the per-user activity log.
RB
Reboots & recovery
Nothing depends on a machine at home. IONOS keeps the website up, and GitHub Actions runs every scheduled job independently — monitors, reports and the order bridge all continue regardless. The Scanner serves the last snapshot published to Supabase Storage: the web tier verifies that object and keeps one local last-known-good copy, so the site still shows the previous scan if a rebuild fails.
🔄
Data flow (one cycle)
Scan the universe > engine detects squeezes > the published snapshot feeds the Scanner > READY setups within 1.5% of entry and above the configured Quality floor flow through the 2-hourly order bridge (or a manual Place-on-IG) > IG working order (28-day life) > fills tracked in working_orders > outcomes measured against hvf_triggers.
Account📅
My Activity
Your account's operational log — logins, password changes, pre-order actions, data refreshes and configuration changes. You only ever see your own entries.
When (UTC)
Category
Event
Terms & Conditions
Terms & Conditions of Service
These terms govern your use of the Squeeze Scanner service. Please read them carefully. By subscribing to or using the service you agree to them.
1. The service
The Squeeze Scanner is a research and execution-assistance tool. It scans a large universe of instruments for one repeatable price structure and, for each qualifying setup, computes an entry, a stop-loss and a target. Where you have connected your own broker (IG) credentials, the service can — at your instruction and within the limits you set — place and manage the corresponding working orders on your own account.
The service does not provide personal financial, investment or tax advice, and nothing it produces is a recommendation to buy or sell. You are responsible for your own trading decisions. Trading leveraged products carries a high risk of loss; prices can fall as well as rise and you can lose more than you expect.
2. Subscription & payment
The service is provided on a monthly subscription basis.
Fees for a given month fall due and are payable within the first 7 days of the following month.
Any management and/or performance fees, and any applicable discounts, are as agreed for your account and shown in the Fees tab.
Non-payment may result in suspension or termination of access. Fees already due remain payable.
3. Availability & service interruptions
We aim to keep the service running but cannot guarantee continuous availability. The service depends on components outside our sole control, and it may be unavailable — in whole or in part — for reasons including, without limitation:
planned or unplanned downtime of our own service;
outages, maintenance, rate-limiting or changes at IG (your broker);
network or internet-connectivity failures; and
failures or delays at third-party data providers.
We are not liable for losses arising from any such interruption, including opportunities missed or orders not placed, amended or closed while the service or a dependency is unavailable.
4. Orders that may not be placed
Even when the service identifies a setup, an order may not be placed, or may be rejected, for reasons including:
the calculated position size is below the minimum size IG will accept;
the instrument or CFD is not available to trade at IG for your account;
your account balance or available margin is insufficient;
a margin call, account restriction or IG-side control prevents the order; or
your own configured limits (minimum Quality, R:R, Volume Score, instrument value, maximum open positions, etc.) exclude it.
You remain responsible for monitoring your account. We do not guarantee that any particular setup will be traded.
5. Access to your broker account
Where you supply your IG credentials, you authorise the service to read your positions and account details and to place, amend and cancel orders that you have approved or that fall within the limits you configure. The service cannot and does not add funds to, or withdraw funds from, your account — it has no ability to move money into or out of your IG account.
6. Credentials & data
Your IG credentials are stored encrypted and are used only to act on your own account. They are never shared with other users and full values are never displayed back to you.
Instrument prices, fundamentals and related market data are obtained from third-party providers. We rely on those sources and do not warrant that such data is accurate, complete or timely; figures shown may be delayed or estimated.
Your activity is logged for security and audit purposes.
7. Liability
To the extent permitted by law, the service is provided "as is" and we exclude liability for trading losses, for the accuracy or timeliness of third-party data, and for interruptions or acts of the broker, data providers or networks. Nothing in these terms excludes any liability that cannot lawfully be excluded.
8. Changes to these terms
We may update these terms from time to time. Continued use of the service after a change takes effect constitutes acceptance of the updated terms.
A research and execution-assistance tool — not financial advice. Prices can fall as well as rise, and trades can be stopped out.
What we do
Spot the setup, place the order, manage the risk
We run a SqueezeScanner engine across over 1,700 instruments — shares, indices, FX, commodities, crypto and government bonds — that finds one high-probability structure, works out exactly where to enter, where to stop out and where to take profit, and — when you connect your broker — places and manages that order for you. Here's the whole service in plain English.
🔎
Spot the structure
Prices coil into a tightening squeeze before they break. The engine scans the whole universe every day and flags these setups the moment they form — so you're looking at a shortlist of ready trades, not a wall of charts.
🎯
Entry, Stop and Target
Every setup arrives with the three numbers that matter: the entry where the breakout triggers, a stop just past the far side of the squeeze to cap the loss, and a target projected from the squeeze's own size. You know your risk and reward before you commit.
🛡️
Risk management
Risk is built in, not bolted on. Position size is a small, fixed fraction of your wallet, the stop defines the most any trade can lose, and your personal floors — minimum Quality, R:R and Volume Score — filter out the weaker setups. You set the limits; we respect them.
⚙️
Automation
Once you're happy with a setup it can be sent straight to your IG account as a working order — entry, stop and target already attached — and tracked from watching → pending → filled to its outcome. Scheduled jobs re-scan the markets and refresh prices so the shortlist stays current without you lifting a finger.
🔒
Security
Your broker credentials are encrypted and only ever used to act on your own account. We can read your positions and place the orders you approve — we cannot add or withdraw funds. Every change is written to your activity log.
🌍
Across every market
One engine, many markets: UK & US shares, world indices, major FX pairs, commodities, a handful of large crypto and government-bond ETFs — over 1,700 instruments watched together, so an opportunity isn't missed just because it's in a corner of the market you weren't looking at.
In one sentence
We watch the whole market for one repeatable structure, hand you the exact levels to trade it with the risk defined up front, and — when you choose — place and manage the order on your own broker account, securely. The How it works tab explains the pattern itself; the Scanner Report shows today's setups.
A research and execution tool — not financial advice. Prices can fall as well as rise, and trades can be stopped out.
Risk awareness
Choose risk you can live with
Returns matter, but the more useful question is whether you can hold the plan through a normal losing run. This guide is educational, not financial advice, and does not change your trading settings.
Three practical profiles
Risk-averse
Prioritise preserving capital. The concave curve means each extra potential gain is worth less than avoiding the next loss. Use smaller position sizes, fewer simultaneous trades and accept slower growth.
Risk-balanced
Accept normal drawdowns for a diversified, rules-based plan. The straight line is a useful benchmark: gains and losses are assessed proportionately, over months rather than individual trades.
Risk-seeking
Can tolerate larger swings. The convex curve illustrates how extra upside can feel increasingly attractive, which makes a maximum loss, position cap and a reason to stop increasing exposure essential.
Before you trade
Could you tolerate the worst drawdown shown by the chosen historical model without changing the rules mid-run?
Is the maximum loss on one position affordable and understood?
Are several open positions exposed to the same market or sector?
Would leverage reduce margin only, or are you deliberately increasing market exposure?
Start with a position size and maximum-open-position cap you can sustain. Historical results are evidence, not a promise.
How it works
Find the coil before the breakout
The Squeeze Scanner hunts one high-probability pattern across over 1,700 instruments — FTSE 100/250, NASDAQ 100, S&P 500, world indices, FX, commodities, crypto and government bonds — and hands you the exact entry, stop and target before the move happens.
The idea — a "squeeze"
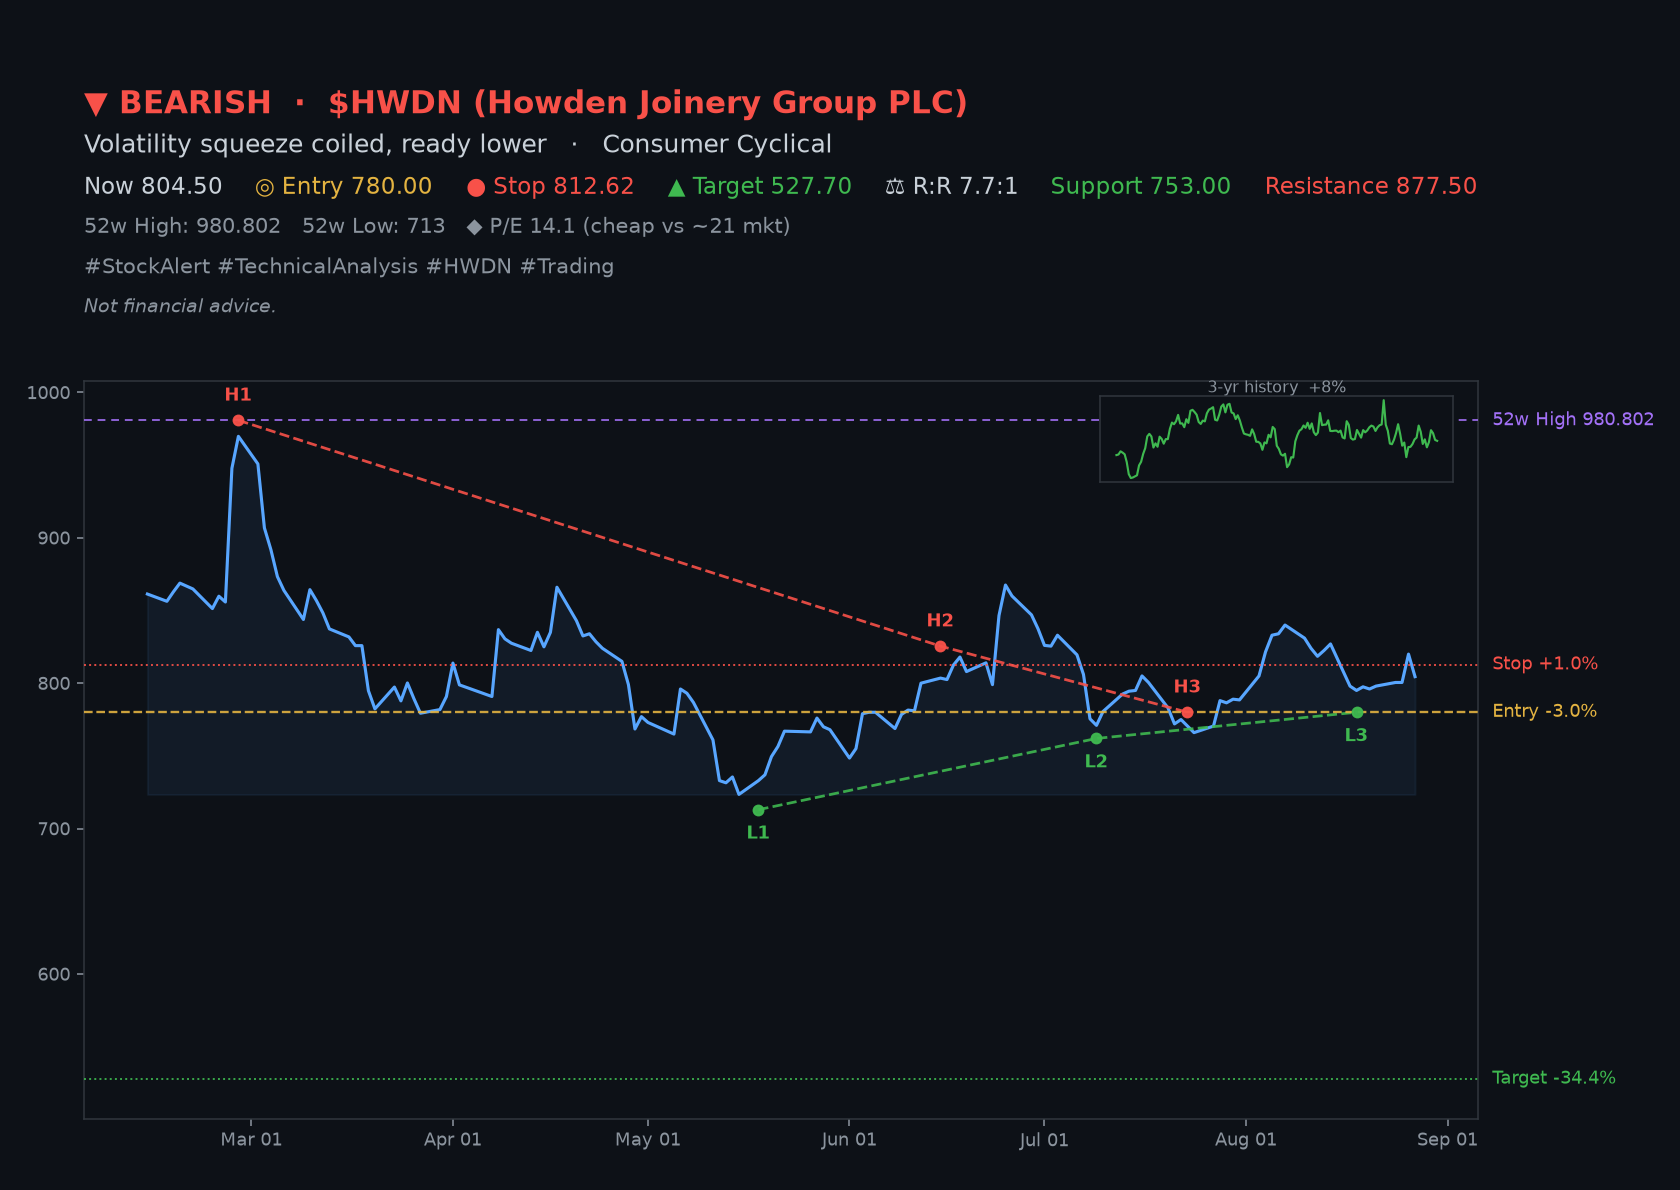
Price coils into an ever-tighter range: each swing high sits a little lower (the red upper jaw H1→H2→H3) and each swing low a little higher (the green lower jaw L1→L2→L3). The market is compressing like a spring.
When price finally breaks out, it tends to move fast and far. The scanner finds these squeezes and computes the entry, stop and target for you.
The squeeze's mouth (H1−L1) is FNM1; the target is projected one FNM1 beyond the midpoint and the stop just past the opposite jaw — that's the R:R.
A real setup, swing highs H1·H2·H3 and lows L1·L2·L3 converging into the squeeze, with Entry / Stop / Target labelled.
1Scan 1,700+→2Detect the squeeze→3Score quality & R:R→4Review the trade plan→5Create an IG order
Using the app
🔍
Scanner
The full table — one row per instrument's best setup. Narrow it with the Filters or Search, and click any column header to sort.
📊
Detail panel
Click a row for the live price chart, the X post card, rule-by-rule justification, fundamentals, broker trend and the published X thread.
📝
Create an order
When a setup meets your rules, review its entry, stop and target in the detail panel, then create the IG working order for your own account. IG must confirm the order before it is treated as live.
🎨
Reading colours
Green = good / in favour · amber = watch · red = poor / against.
📖
Every term
The Appendix tab defines every metric, level and status used across the app. Not financial advice — a research tool.
Reference
Appendix & glossary
Every term, level, status and metric used across the Squeeze Scanner, defined in one place.
The pattern
Squeeze
A volatility contraction where price coils between converging highs and lows before a momentum breakout.
Upper jaw / Lower jaw
The line through the swing highs (descending) and through the swing lows (ascending). They converge to form the squeeze.
H1, H2, H3
The three successive swing highs (each lower than the last) that define the upper jaw. H3 is the most recent.
L1, L2, L3
The three successive swing lows (each higher than the last) that define the lower jaw. L3 is the most recent.
FNM1
"Squeeze mouth 1" = H1 − L1, the height of the squeeze's mouth. The target is projected one FNM1 beyond the midpoint.
Levels & the trade
Entry
The break level that triggers the setup: H3 for a long, L3 for a short.
Stop
Protective exit just beyond the opposite jaw.
Target
Projected objective: squeeze midpoint ± FNM1.
R:R (Reward : Risk)
(target − entry) ÷ (entry − stop). We look for ≥ 3 : 1.
Dist→Entry
How far (%) the current price is from the entry level.
Since trig
Price change since it triggered, from the entry level (green = in the trade's favour).
Status & timing
TRIGGERED
Price has crossed the entry; actionable now.
READY
Squeeze complete, waiting for price to cross the entry (a "pre-order").
DEVELOPING
The squeeze is still forming.
Triggered (date)
The date the trigger pivot (L3 long / H3 short) formed.
Days since
Days since that trigger date.
Timeframe (D240 / D180 / D90 / weekly …)
The chart window the squeeze was found on. The engine scans several and reports only the strongest per instrument.
Pre-order
A READY / DEVELOPING setup that hasn't triggered, so no order exists yet.
#Open / X posts
Open IG positions in that name / how many X posts we've published for it.
Quality score
Quality (0–100)
Combines tightness (up to 50: how compressed vs FNM1), freshness (up to 30: how recently H3 formed) and symmetry (up to 20: how evenly the swings are spaced). 100 = very tight, fresh and symmetric.
Fundamentals (per company)
P/E (trailing / forward)
Share price ÷ earnings per share (historic / forecast).
PEG
P/E relative to earnings growth (≈1 = fairly priced for its growth).
Price/Book · Price/Sales · EV/EBITDA
Valuation multiples vs book value, revenue, and enterprise value/earnings.
EPS
Earnings per share (trailing / forward).
Dividend yield / rate / payout ratio
Annual dividend as a % of price / per share / as a % of earnings.
FCF · OCF
Free Cash Flow (cash after capex) · Operating Cash Flow.
Gross / Operating / Profit margin
Profit at each level as a % of revenue.
ROE / ROA
Return on equity / on assets.
Revenue / Earnings growth
Year-on-year growth rates.
Debt/Equity · Current ratio · Quick ratio
Leverage and short-term liquidity.
Beta
Volatility relative to the market (1 = moves with it, >1 = more).
Market cap · Revenue · EBITDA · 52-week range
Size and trading range.
Broker & data
Broker analysis
Analyst Buy/Hold counts plus net upgrades − downgrades over the last 6 and 12 months.
Source (YF / IG)
Where a stored price came from. IG (the broker feed) is the truth and overrides Yahoo on disagreement.
double_checked
A stored daily price a second source confirmed (IG agreeing with Yahoo).
Golden dataset
The audited, corrected price history kept in the database and verified daily.
Coverage
Markets
Every market we scan, with its live coverage from the current snapshot — how many instruments it holds and how many have a squeeze setup right now. Click a market to filter the Scanner to it.
⚠️ These switches change what you see AND what you trade.
Turning a market off here hides it from your Scanner and Pre-orders and blocks you placing or pinning orders in it (user 2026-08-01).
The shared automated 2-hourly bridge trades one IG account, so it is gated app-wide by Markets (Admin), not by your personal switch —
to stop a market trading for everyone, switch it off in Markets (Admin).
Market
Visible
Instruments
With signal
Triggered
Ready
Developing
Avg Quality
Per-market data import and Squeeze-report processing controls live in Markets (Admin) (admin only) — coming in a later delivery.
Which attributes actually separate a winning squeeze from a losing one.
Exactly how the recommendations are computed, for external review.
Which tested settings survived wallet, margin, trade-count, and drawdown constraints.
What your current filters would have produced over the selected period.
What changes when exits are simulated differently; live orders are unaffected.
How many observed triggers gained, lost, or remain open.
Explore the evidence behind the recommended settings (Silver/Gold admin).
💷 Replay modelThese are wallet and capacity assumptions only. Signal rules (Quality, R:R, VolumeScore, RVOL, VWAP, ATR and market/sector scope) are chosen in Best settings and saved in User Configuration.
Results
Performance
Performance separates observed trade outcomes from constrained what-if models. A return is direction-aware, so positive is always in your favour; open trades are marked to the latest price. The settings shown in each panel are the settings used for that panel, not a promise of future results.
What separates the winners?
Which market and signal attributes were associated with the strongest outcomes.
Every tradeable setup over the last 12 months (user 2026-07-18),
replayed from price history — the full period, not just the recent recorded triggers. Assume each was placed, so this is the
performance of what's possible. Return % uses the same direction-aware, marked-to-market definition as the Results
report. The £ figures place a stake of 2% of the wallet at that point in time on every trade and compound it:
net £ = stake × the trade's return%; the stake starts at £20 on £1k and grows as the wallet does (winners raise the
next stake — 1,000 → 1,025 → 2% of 1,025 …). The stop caps each loss at stake × the stop distance % — a few pounds.
The ledger below is every trade in strict chronological order by trigger date, so you can follow the wallet build.
Each row is one whole trade — placed on its trigger date; the Outcome column is how that trade eventually
resolved (TARGET / STOPPED / still OPEN), not a separate open/close event.
Summary
Every recorded trigger split by direction. Returns Available counts every trigger with a return figure — including Open trades marked to the latest price; Gains / Losses / Break-even, Win % and Loss % are measured against those. Reacts to the date filter and the Location buttons above.
Back Test
These are back-test results over the last 12 months, replayed against your complete current configuration: direction, enabled markets, saved market/sector scope, R:R, Quality, Volume Score, RVOL, VWAP, ATR, instrument value and wallet limits. Applying a Best Settings option updates this replay immediately. Each setup is measured from its trigger to TARGET, STOPPED or OPEN (marked to the latest price).
Every recorded trigger
💷 Wallet model— Stake / Net £ / running Wallet / Open
#
Name
Direct
RVOL
VWAP
ATR
Vol
R:R
Quality
Outcome
Market
Triggered
Return
Stake
Net £
Equity
Open
Days Open
Closed
Stop
Entry
Target
Now
MCap
Sector
Ticker
🏃 Let winners run
Compare selling at TARGET with locking in that target gain and trailing the remaining move. Change the values below to test their historical impact before changing your live configuration. This report is an illustration only — it never saves settings or changes live orders.
What-if settings
Best settings for annual profit
Compares complete configurations over the last 12 months and replays only positions the Model wallet could actually fund. Choose between several distinct objectives rather than one unexplained answer. Every option includes the signal floors, scope and trading limits that will change; after applying one, Back Test immediately uses the same complete configuration.
Personalised using:current replay model
⏳ Data loading…
Best settings history
⏳ Data loading…
🏃 Let winners runonce target hits, the stop moves up to target then trails — so 17% can't decay to 7%. Illustration only — never moves real orders.
🎯 Trailing-stop illustrationre-backtests each trade with a stop that trails by entry × gain × this % on the close. 0 = off. Illustration only — never moves real stops.
⏳ Data loading…
📊 VolumeScore impact — how volume confirmation filters the winners
Same 12-month replayed population as above. Win rate, average return and the concurrency-capped £ for the whole book vs the VolumeScore ≥ 8 subset, and where profit concentrates by score band.
⏳ Data loading…
🏅 Best settings by quarter
For each calendar quarter over the available replayed data (up to 3 years — extends as history grows), the Market, Quality band and R:R band with the highest average return (min 3 trades). Answers "which settings worked, and how that shifts over time".
⏳ Data loading…
Instruments
The full universe we scan — search by name or ticker, filter by Location / Market / Sector / Status, and (once logged in) see Direction, Quality, R:R, RVOL, VWAP, ATR and VolumeScore. Click a name to open its full detail report.Log in to see the trading signals and open a detail report.
Name
Location
Market
Sector
Direct
Quality
52wk Low
52wk High
R:R
RVOL
VWAP
ATR
Vol
Ticker
⏳ Data loading…
📜 Squeeze history
Recent squeeze lifecycle events — developing → ready → triggered → outcome — for the instruments shown above (newest first, capped at 30 rows).
Direct
Ready
Triggered
ATR
VWAP
Quality
R:R
RVOL
Vol
Outcome
Closed
Return
⏳ Data loading…
Insights
What the data is saying right now
A short, deliberately limited page. Each
insight is recomputed daily from the full trigger history and re-tested every time it is published,
so one that stops being supported says so rather than quietly staying on the page.
⏳ Data loading…
Admin
Squeeze History
Every squeeze's journey through the engine — developing → ready → triggered → outcome — replayed over the price history. Each row is one squeeze with the dates it changed state and how it resolved (TARGET / STOPPED / OPEN / NEVER TRIGGERED). Newest first.
Name
Direct
Market
Developing
Ready
Triggered
Outcome
Closed
Return
Quality
R:R
TF
Sector
Ticker
⏳ Data loading…
Admin
Fees
How the account is charged. Two monthly fees, both billed monthly.
🏦
Management fee
1% / year of assets under management (AUM), including the cash balance — charged monthly as 1% ÷ 12. Industry norm is usually 1.5%+ p.a.
📈
Performance fee
10% / year on profits only (nothing charged in a losing month) — charged monthly as 10% ÷ 12. Industry norm is usually 15%+ p.a.
Worked example — last month
Period
rates are per annum; the monthly charge = rate ÷ 12 — management = (1% ÷ 12) of AUM; performance = (10% ÷ 12) of the period's profit (0 if a loss)
Transactions this period
The closed trades whose realised P&L makes up the profit the performance fee is charged on.
View:
Trading method
Trading — Multi-Factor Momentum
The commodity engine doesn't trade on price patterns alone. It stacks three layers of fundamentals — macro drivers, positioning, and physical supply/demand — so a momentum trade is only taken when the underlying economics agree with the chart. This is how we stay in structurally-supported trends and avoid fading moves that are backed by real forces.
Layer 1 — Macro drivers
💵
USD strength
Most commodities are priced in dollars. A weak USD is bullish (gold, oil, metals); a strong USD is bearish. Measured by DXY vs its 20-week average + 4-week rate of change.
📉
Real yields (10Y TIPS)
Falling real yields lower the opportunity cost of holding non-yielding assets → bullish gold & silver. Rising real yields are bearish precious metals. Source: FRED DFII10.
🔥
Inflation expectations
The 5-year breakeven. Rising → bullish energy, industrial metals, agriculture. Falling → broadly bearish. Source: FRED T5YIE.
🌐
Global growth cycle
Expansion lifts industrial commodities (copper, oil); contraction favours precious metals as a haven. Proxied by the 10Y-2Y yield curve and manufacturing employment.
Instrument-specific weightings
Instrument
USD
Real Yield
Inflation
Growth
Gold (XAUUSD)
30%
40%
20%
10%
Silver (XAGUSD)
25%
30%
20%
25%
Oil (OIL)
20%
10%
35%
35%
Copper
20%
5%
20%
55%
Layer 2 — COT (Commitment of Traders)
The CFTC's weekly positioning data is the most reliable lead indicator for turning points. Commercial hedgers (producers/consumers) are the smart money — extreme net-long positioning flags a bullish turn, extreme net-short a bearish one. Managed money (hedge funds) is right mid-trend but wrong at extremes, so a crowded net-long is a contrarian bearish signal.
Open-interest signal
Price
Open interest
Signal
Meaning
Rising
Rising
REAL_MONEY_BUY
New longs entering — strong
Rising
Falling
SHORT_COVERING
Shorts exiting — weaker
Falling
Rising
REAL_MONEY_SELL
New shorts entering — strong
Falling
Falling
LONG_LIQUIDATION
Longs exiting — may exhaust
Layer 3 — Supply & demand
Falling inventories + rising demand → bullish; rising inventories + weak demand → bearish. Oil leans on the EIA weekly petroleum report (a draw > 2M barrels is bullish, four consecutive draws strongly so); precious & industrial metals on COMEX/LME warehouse stocks. A geopolitical-risk factor (OPEC+ decisions, mining strikes, weather) acts as an amplifier — it widens stops and trims size rather than blocking a trade.
Source: docs/commodity_fundamentals.md (Layers implemented in commodity_macro.py, cot_analysis.py, commodity_supply_demand.py).
Admin
Change Requests
Every change-request file in ChangeRequests/, parsed into individual requirements. Each file shows its total actions and how many are Completed, In Progress, Not Started, Cancelled or Deferred. The In Progress count is kept live as work is picked up. Click a row to read the full breakdown; every requirement has a stable #row number. In the breakdown, Working Area is the nearest "Application Focus – …" heading above the requirement, and Scope is "NEW DELIVERY" when that heading is tagged as a new delivery (its text ends with "– NEW DELIVERY"), otherwise blank.
File
Created
Last updated
Actions
Prioritised
Completed
In Progress
Not Started
Cancelled
Deferred
P01-05
P06-10
P11-25
P26+
Admin
Configuration (Admin)
Application-wide settings shared across the service. Admin only; every change is recorded in your activity log.
Bridge quality floor 🔶 ADMIN
Minimum pattern Quality (0–100) a setup needs before the 2-hourly bridge auto-loads it as a pre-order / IG working order.
Minimum Quality (Q)
Spread retries 🔶 ADMIN
When the quoted spread is too wide, how often and how long to retry before skipping the trade.
Spread retry attempts
Spread retry wait (secs)
X publishing 🔶 ADMIN
Application-wide X-publishing limits, stored in the database and read by the publisher on both the local server and GitHub Actions (code fallback if the DB is unreachable). Credentials live in X Credentials below.
Max X publications per day (UTC)
Superinvestor lookback (days)
Min senator trades (not currently consumed by the engine)
Admin view of every scanned market with its live coverage, plus data-import processing. Rebuilding rescans the universe and refreshes the snapshot that feeds the Scanner, Pre-orders and reports.
Market
Enabled
Instruments
With signal
Triggered
Ready
Developing
Avg Quality
Rebuild currently reprocesses the whole universe in one pass (the engine builds every market together). Per-market isolation and a separate Squeeze-report run are a planned enhancement.
Trading
IG Account
Your own IG account — open and recently closed transactions, plus working orders. Shown for the account whose credentials you use (owner uses the shared account; others use their own from Configuration → IG).
Default sort: latest opened/closed ↓View:Closed:
Close history— every close you have requested, with IG's recorded outcome
Select
Status
Name
Market
MCap
Direct
Size
Open
Now / Close
Profit
Profit %
Stop
Limit
Ccy
Opened (UTC)
Closed date/time (UTC)
Why closed
Ticker
A position is closed here only on the day it opened, and only for the break-bar measures that could not be tested when the order was placed — RVOL, VolumeScore, above-VWAP and ATR. R:R, Quality and instrument value are recorded when they are also breached, but never act as the reason: those were knowable at placement, so a breach is a gate defect rather than a reason to sell.